For most ergonomic chair importers, procurement starts and ends with one number: the FOB Price. However, if you are only looking at the unit price, you are likely making a fatal mathematical error that is “bleeding” your margins before the goods even arrive.
In this guide, we’ll break down the industry’s “CBU vs. KD” secret and show you why a $32 chair is actually $4.70 cheaper than a $30 chair at your warehouse door.
1. Understanding the Terminology: CBU vs. SKD vs. KD
When sourcing from China, the packing method dictates your shipping efficiency.
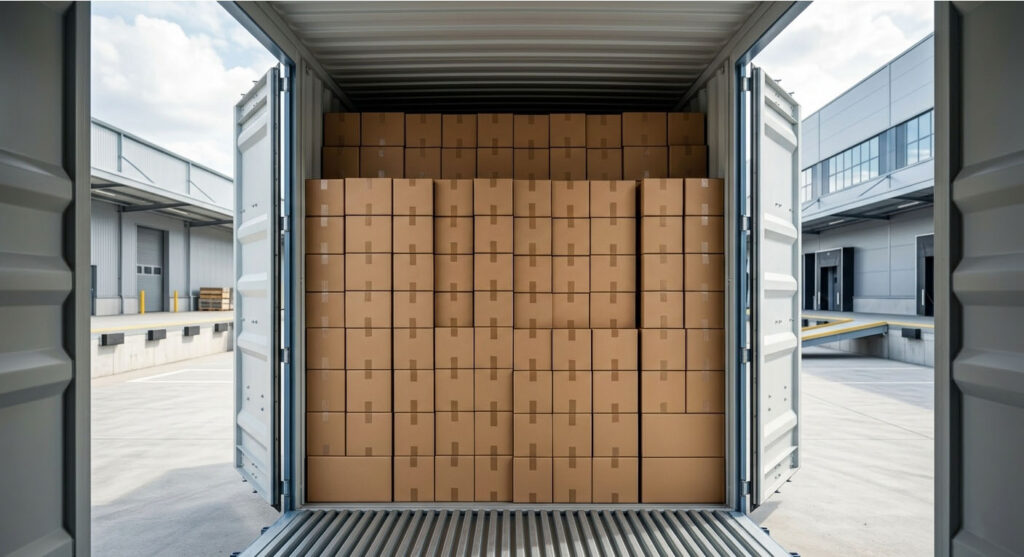
- CBU (Completely Built Up): The chair is fully assembled or nearly assembled. While it saves local labor, it is “shipping air.”
- SKD (Semi-Knocked Down): Major components are pre-assembled, but the chair is separated into 2-3 pieces.
- KD (Knocked Down): The chair is completely disassembled into its base components (mechanism, gas lift, casters, seat, back). This is the “Smart Choice” for high-volume distributors.
2. The Case Study: Supplier A vs. Zechu Protocol
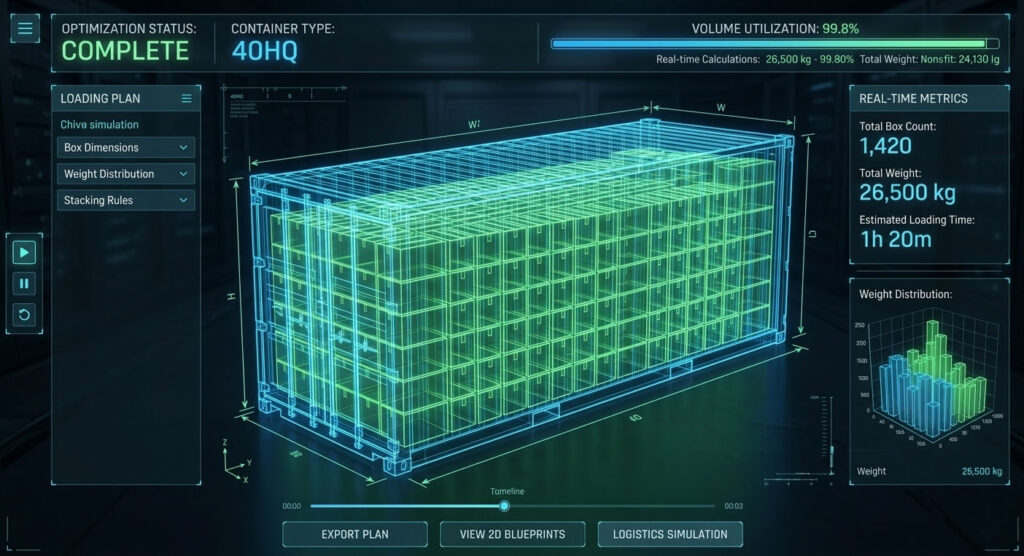
Let’s look at the actual math based on a standard 40HQ Container with an assumed sea freight of $8,000.
The Comparison Table
| Metric | Supplier A (The “Cheap” Choice) | Zechu Protocol (The “Smart” Choice) |
| FOB Price | $30.00 | $32.00 |
| Packaging | Standard, Bulky Carton | Space-Engineered KD |
| 40HQ Capacity | 400 chairs | 600 chairs |
| Freight per Chair | $20.00 | $13.33 |
| TRUE LANDED COST | $50.00 | $45.33 |
The Mathematical Formula
To calculate the True Landed Cost ($C_{L}$), we use:
$$C_{L} = P_{FOB} + \frac{F_{Total}}{Q_{Container}}$$
Where:
- $P_{FOB}$ is the Unit FOB Price.
- $F_{Total}$ is the total sea freight cost.
- $Q_{Container}$ is the number of units that fit in a 40HQ container.
By increasing $Q_{Container}$ from 400 to 600, the freight cost per unit drops by over 33%, more than offsetting the $2 price increase.
3. The “Silent Killers” of Margin: RMA and BOM Substitutions
Low-cost factories don’t just sacrifice space; they sacrifice the parts you can’t see.
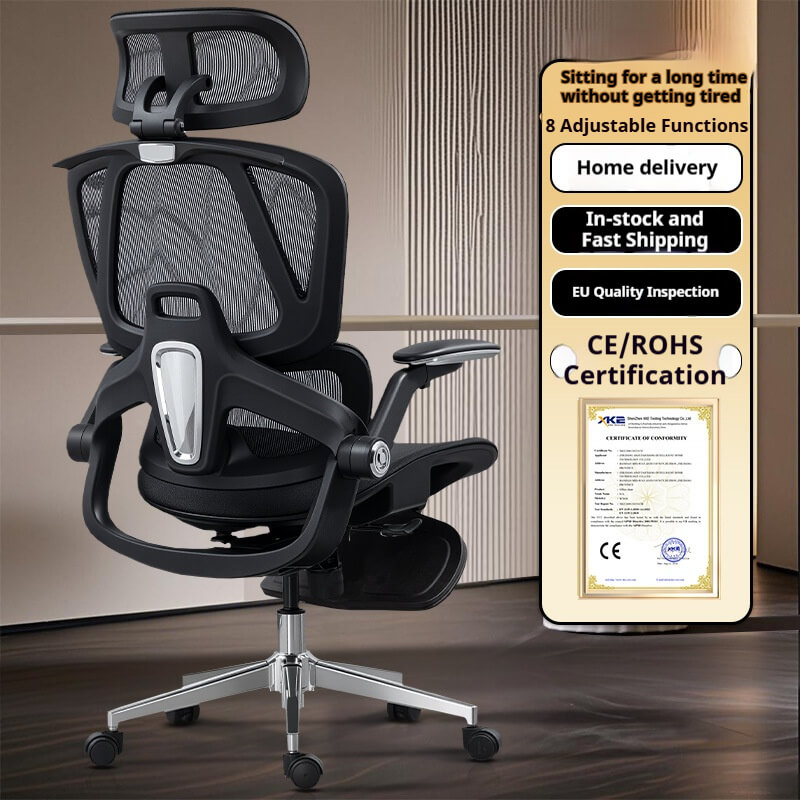
- Class-2 vs. Class-4 Gas Lifts: Supplier A often uses Class-2 gas lifts, leading to a 5% RMA (Return Merchandise Authorization) rate. Zechu uses Class-4 KGS gas lifts, resulting in 0% RMA and zero customer complaints.
- BOM Locking: We lock our Bill of Materials (BOM) to ensure zero substitutions during mass production. No “quiet downgrades” on foam density or mechanism thickness.
4. Conclusion: Start Buying Predictable Margins
If your goal is Total Cost of Ownership (TCO), stop fighting over $1-$2 on the FOB price. Instead, focus on packaging engineering and BOM stability.
“Stop buying chairs. Start buying predictable margins.”
Get Our Internal Sourcing Protocol
Want to see how we achieve 600-unit container density without compromising assembly time?